EventDisplay Events
Visualization of an event
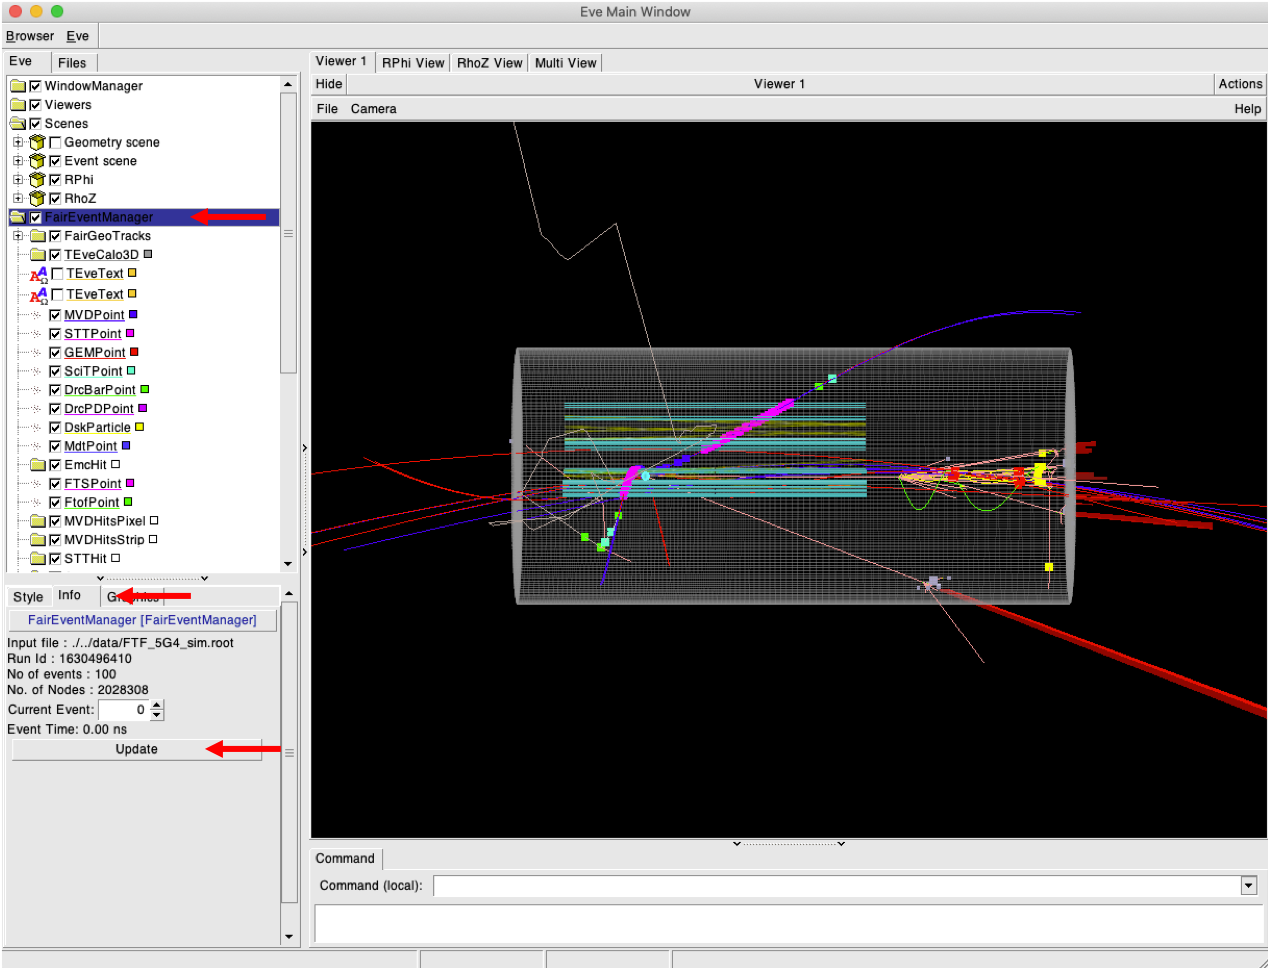
An event can be displayed via Eve browser, FairEventManager, tab Info.
Either one can use the Update button or switch to a specific event via
Current Event: (see red arrows).
It is advisable to disable the visualization of the geometry or set the
transparency via the tab Graphics to a high value.
Depending on the root files provided, different sets of data are displayed:
- sim file provided
Display of MC tracks
If
FairRunSim::SetStoreTrajis set totruein the sim macro, the MC tracks are displayed in the event display. The tracks contain the type of particle its MC momentum and the flight path. The flight path is plotted using fulcrums stored in the sim process. Therefore the displayed track is interpolated in between the fulcrums and not precise. A single track can be selected in the event display and its properties are displayed. The complete list of tracks is listed in theEve browser, in the folderFairGeoTracks. Here the display of the different particle types can be enabled and disabled.Display of MC points
The MC points of the different detectors are displayed as boxes. The color of the points can be set in the
eventDisplay.Cmacro.Display of EMC data
To display MC data from the EMC two methods exist
PndEmcHitDrawandPndEmcHitCaloDraw.PndEmcHitDrawdraws a box at the crystal position with the deposited energy as value.PndEmcHitCaloDrawdisplays the deposited energy as a tower with different hight at the crystal position on a barrel sitting approx. at the position of the EMC.
- digi file provided
Display of reconstructed hits
The position of the reconstructed is displayed as boxes. The corner of the box corresponds to the reconstructed hit position. Single hits or ranges of hits can be disabled from visualization via the tab
Style. TheOverflowbehavior should be set toCut. TheMain rangecan then be used to display only specific groups of hits. The range number usually corresponds to the hit id (the position in the TClonesArray) of the data.Display of STT hits
Using the standard
FairHitDrawto display the STT reconstructed hits gives the mid position of the fired tube but no isochrone information. A more realistic view is the visualization viaPndSttIsochroneDrawwhich draws a tube with the length and position of the fired straw tube and a radius matching the isochrone radius.
- reco file provided
Display of reconstructed tracks
Which reconstructed tracks are displayed is selected in the
eventDisplay.Cmacro by giving the branch name of thePndTrackdata. For each track two data sets are drawn. The first one are the track parameters given by a momentum vector at the start of the track in red and the momentum vector at the end of the track in blue. For the barrel part also a helix segment can be plotted. Forward going tracks are missing this feature.The second data set is a collection of hits belonging to a track. As default, all hits of all tracks are displayed. If just a specific track should be plotted one can select this track via the tab
Style. One has to setOverflowtoCutand then use theMain range:to select the specific track. The track number here corresponds to the track number for the track parameters.